Overview
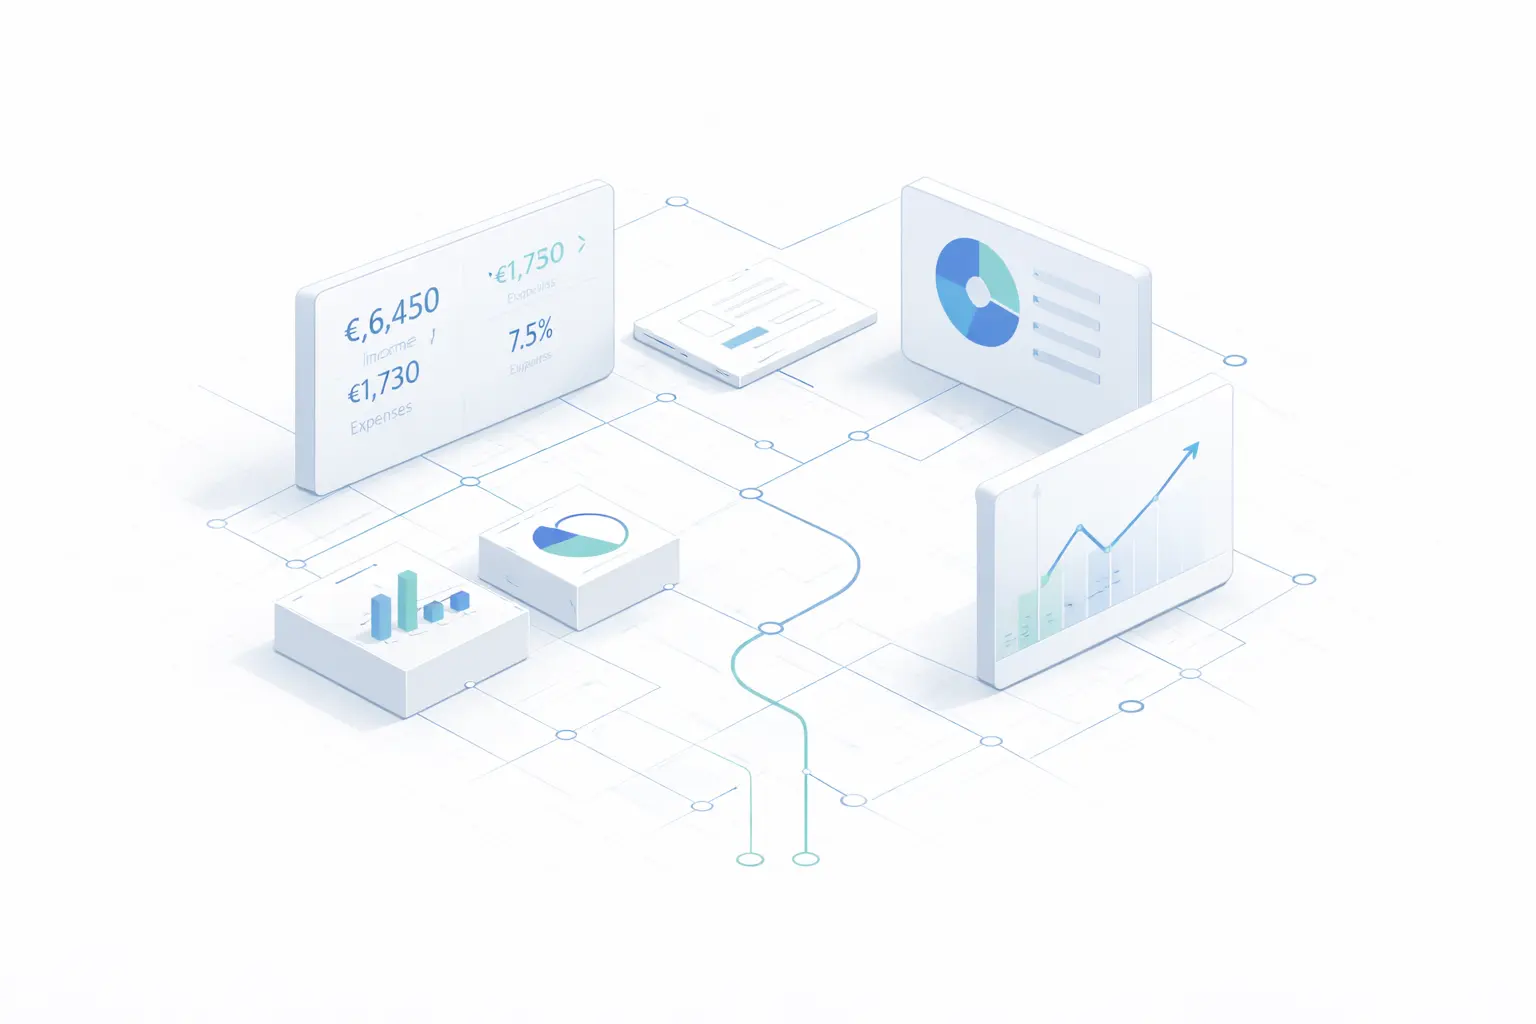
See where your portfolio stands and which areas need your attention. In addition to the home page, SmartLandlord offers dedicated dashboards for properties, financing, energy, location, and management. Each view brings together the key metrics relevant to its area.
Home Page: Your Daily Summary
The home page displays key figures such as portfolio value, monthly cash flow, return on equity, and gross rental yield. A table of financial indicators includes projected, actual, and trend values. Trends over time and alerts about your portfolio help you interpret anything that catches your attention.
Real Estate Dashboard: Analyze Your Portfolio in Depth
Choose specific properties or your entire portfolio as the basis for the statistics. This view provides access to analysis of the entire portfolio, property comparisons, and diversification. This allows you to broaden your perspective from individual properties to the entire portfolio.
Financial Panel: Loans and Mortgage Payments
Track financing, outstanding debt, interest, amortization, and monthly payments. Tables, trend charts, and an aggregated amortization schedule help you view your portfolio’s financing as a whole. Selecting specific properties narrows the analysis; this view includes a PDF export feature.
Energy Dashboard: Compare Usage and Costs
The energy dashboard consolidates energy analyses related to properties and those created separately. Consumption, heating costs, CO₂ emissions, and the categories listed in the analyses are compared in tables and charts. From the summary, you can open each individual analysis.
Location Panel: All Your Area Ratings
Compare saved location assessments, overall scores, and partial scores for socioeconomic factors and infrastructure. The summary separates property-specific analyses from independent assessments and provides access to each detailed view.
Management Dashboard: Deadlines and Risks Under Control
The management summary rounds out the financial overview with an analysis of actual versus projected figures, cash flow projections, rental yields, and expense tracking. The risk dashboard compiles alerts regarding expiring leases, vacancies, late payments, maintenance, financing, and review tasks.
The reliability of all reports depends on the portfolio, rental, and payment data being complete and accurate. Check the key indicators and alerts in their source process; a summary is no substitute for a professional review.