Overview
The portfolio brings together all the features you need for centralized management of your real estate portfolio. In “My Portfolio,” you can manage your properties using master data, property details, and current metrics. “My Financing” displays all loans along with their repayment status and outstanding balance.
My portfolio: overview of all properties
My Portfolio is a centralized overview of all saved properties and brings together all your portfolio management in one place. Every property you add to your portfolio from an ImmoCheck appears here with all recorded data and calculated metrics.
There are four ways to add properties: New Property (complete ImmoCheck form), Quick Add (fast setup with essential details), Bulk Import (add multiple properties at once via CSV or Excel), and Create from a Scenario. The Compare button lets you compare multiple properties with each other.
Portfolio statistics
Four indicators at the top show the current status of your portfolio: the total number of properties, the total living area in square meters, the total value of all properties, and the monthly rental income. These figures are updated automatically whenever changes occur.
Two views for different needs
The grid view displays each property as a card showing the most important details: ID, address, purchase price, rent (including heat), purchase date, year of construction, and square footage. From the card, you can directly open the analysis (ImmoCheck results). This view is ideal for a quick overview.
The table view displays all properties with detailed information and customizable columns: parking spaces, financing details, maintenance fees, tax information, and calculated metrics. The table allows you to sort the data by clicking on the column headers and export it to JSON, XML, CSV, and Excel.
Search and filters
The global search lets you search by name, address, state, and other property details, and displays results instantly as you type. Basic filters allow you to narrow your search by region, year built, and price range. Advanced filters add more options—purchase price from/to, square footage from/to, year of construction from/to, minimum yield, and cash flow status—so you can quickly find the properties that interest you, even in large portfolios. The “Reset” button clears all filters.
Property Details: Detailed View and Editing
Each property has its own profile, containing all the recorded data. The header displays the address, a map showing the location, the gross yield, a comparison of pre- and post-tax cash flow, and a direct link to “View ImmoCheck.” The information is organized into tabs that you can edit and save independently: Property Details, Financial Data, Income and Expenses, Tenants, Operating Costs, Reports, and Documents.
Property details
Master data includes the property type, year of construction, floor area, purchase price, purchase date, number of rooms, parking spaces, and equity. The purchase price per square meter and the total investment amount are calculated automatically. (If the property has active units or tenants, the single-family/multi-family type is locked to ensure data consistency.)
The property details are listed using checkboxes—balcony, garden, furnished, elevator, listed building, energy certificate—and additional fields: heating type, kitchen appliances, flooring, apartment number, energy efficiency class, and energy consumption.
Financial data
The Financing tab displays summary information: total loan amount, weighted average interest rate, weighted average repayment installment, financing start date, equity contributed, and monthly payment. Detailed management of each loan is handled in “My Financing.”
The tax parameters used to calculate profitability—depreciation method, depreciation rate, rate and duration of special depreciation, personal tax rate, and the non-depreciable portion corresponding to the land—are also managed in this section.
Revenue and Expenses
The income side includes rent excluding charges, parking space rent, and projected increases in rent and value. Rent including expenses is automatically calculated based on rent excluding expenses, pass-through expenses, and parking space rent. The expense side includes pass-through and non-pass-through expenses, property tax, other expenses, the maintenance reserve, and the reserve for rent delinquency.
The remaining tabs complete the property management system: “Tenants” for tenants and leases, “Operating Costs” for expense reports, and “Reports” and “Documents” for related documentation.
My loans: loan details
"My Loans" lists all the loans in your portfolio along with their repayment status. Four key metrics summarize the situation: total amount, monthly payments, average interest rate, and outstanding balance. From here, you can create a "New Loan," search by lender, loan type, or amount, and filter by region, lender, loan type, and interest rate.
Each loan is displayed in a record that includes the associated property, the loan type (e.g., fixed-rate mortgage), the amount, the interest rate, the amortization rate, and the start date. When you open the details, you can see all the parameters, and the system uses them to calculate the monthly payment.
Repayment Schedule and Outstanding Debt
For each loan, an amortization schedule is maintained that shows the current status, the outstanding balance, and the changes over the term. If a property has multiple loans, the weighted average values of the interest rate and the monthly payment are calculated.
Funding Structure
It is possible to combine different types of loans: an annually amortized loan as the primary financing, supplemented by subsidized or subordinated loans. The summary shows the aggregate amounts of all individual loans.
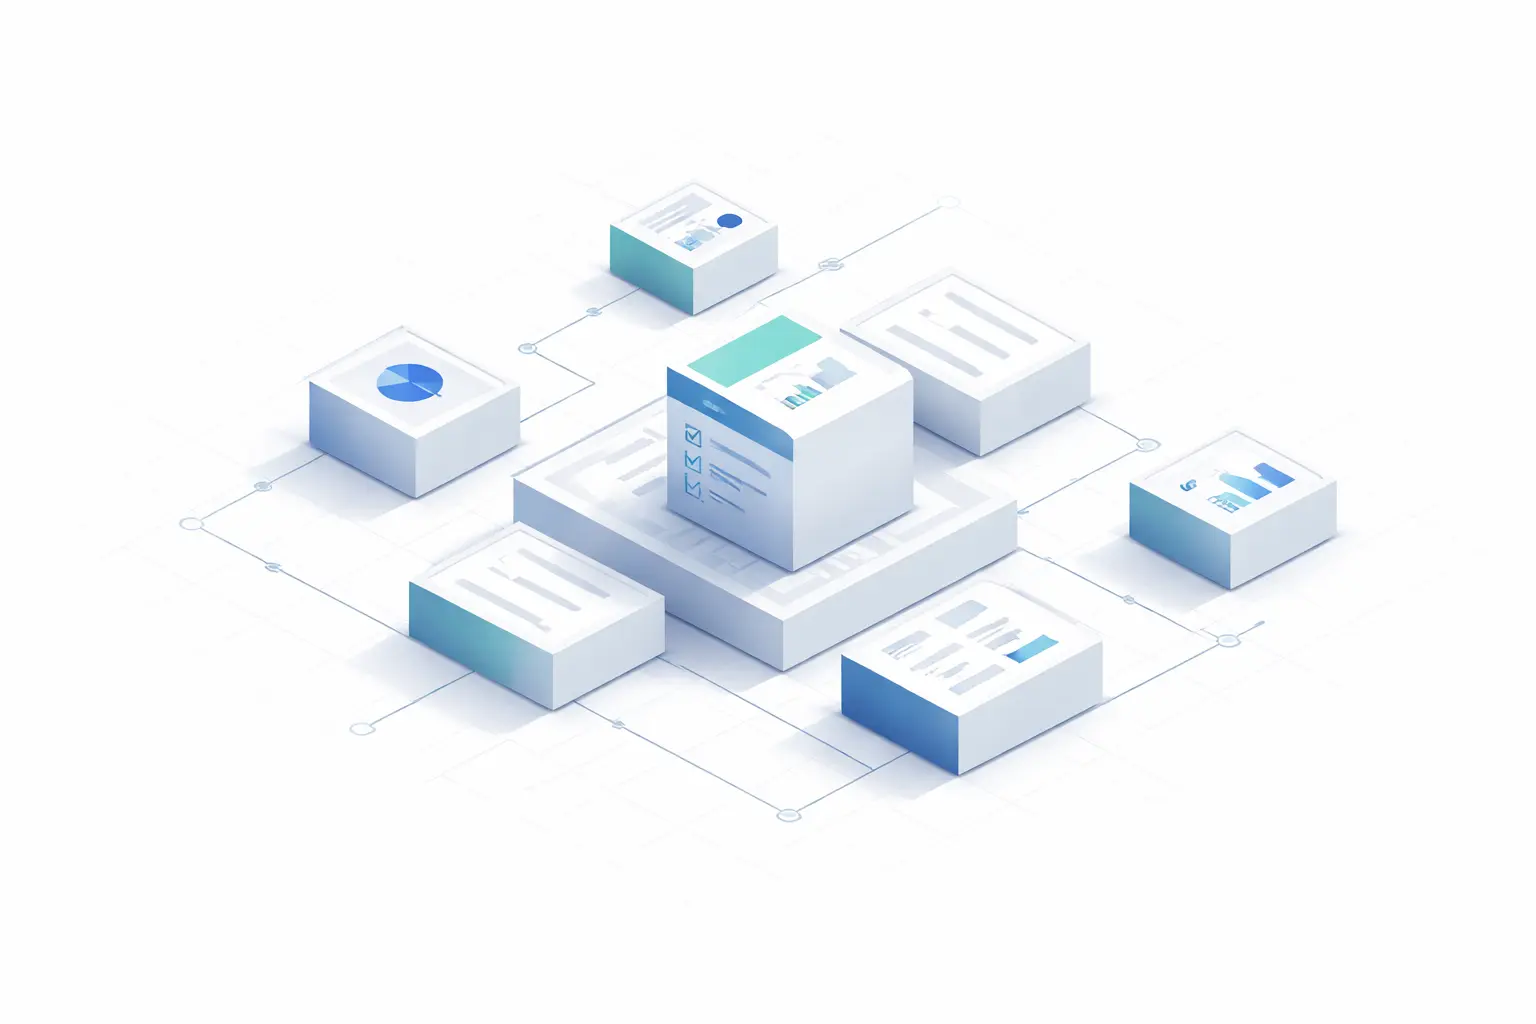
Data flow between modules
The modules in the portfolio are interconnected. Properties are added through ImmoCheck; the data entered there becomes available in “My Portfolio” and can be modified later. Financing data from ImmoCheck appears in “My Financing,” where it can be managed in detail. Any changes made in one module are reflected in the calculated metrics across all linked areas.
Export and Documentation
The "My Portfolio" table view allows you to export data in four formats: JSON and XML for technical processing, CSV for spreadsheets, and Excel for direct editing. This way, you can prepare the data for tax advisors, financial partners, or your own analysis.